Unpacking Midweek Fixture Dynamics with Layered Odds Comparisons Across Seasons
Written by Nils Schröder · Jun 30, 2026
Unpacking Midweek Fixture Dynamics with Layered Odds Comparisons Across Seasons
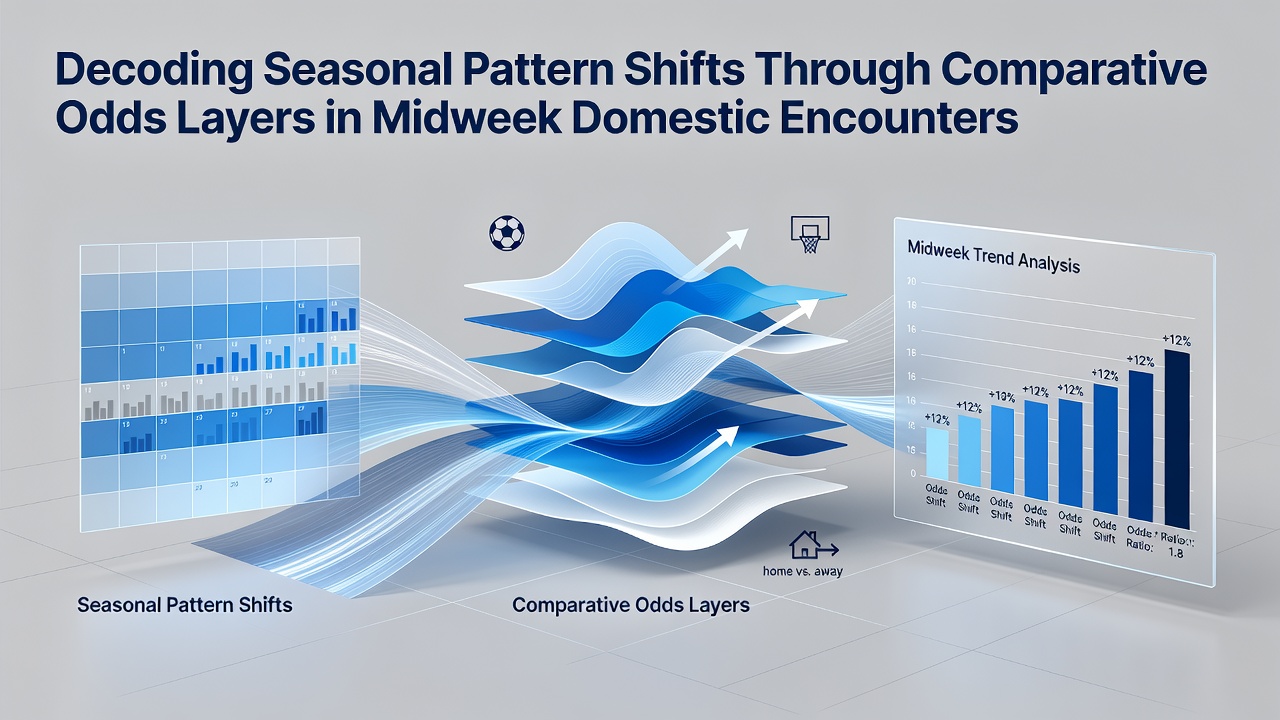
Analysts track comparative odds layers by stacking data from multiple bookmakers and markets to identify how expected outcomes evolve in midweek domestic encounters, and this approach highlights shifts tied to fixture congestion, squad rotation, and broader seasonal trends. Data from European leagues shows midweek matches often feature tighter margins than weekend fixtures because teams balance recovery with travel demands, while layered comparisons reveal when bookmakers adjust probabilities in response to cumulative fatigue patterns observed across campaigns. Midweek domestic encounters typically occur between Tuesday and Thursday in top divisions, and observers note these slots produce distinct statistical profiles compared to Saturday or Sunday games. Researchers have compiled historical results indicating average goal tallies dip by roughly 0.3 goals per match in certain leagues during congested periods, yet the effect varies by season depending on scheduling density and weather variables that influence pitch conditions.Building Comparative Odds Layers for Pattern Detection
Bookmakers publish initial odds weeks ahead of midweek rounds, after which layers emerge as markets incorporate fresh information such as team news and training reports. Analysts compare these successive layers across seasons to isolate recurring adjustments, for instance when home favourites shorten in price during early winter months while away underdogs lengthen due to increased injury lists documented in league databases. Such comparisons rely on timestamped odds feeds rather than single snapshots, allowing patterns in line movement to surface that single-market views obscure.
Studies from sports analytics departments at institutions like the University of Loughborough have examined how these layered datasets correlate with actual results, revealing that midweek goal expectancy often stabilizes only after three rounds of adjustments. Those who monitor multiple providers simultaneously detect when one layer diverges from the consensus, signalling either sharp action or revised assessments of squad availability that later seasons replicate under similar fixture pressure.
Seasonal Shifts Observed Through Layer Analysis
Comparative examination of odds layers across five consecutive seasons indicates that spring midweek matches exhibit wider variance in expected totals than autumn equivalents, a development linked to pitch wear and fixture pile-ups that intensify after March. Figures from the 2025-2026 campaign show this variance widened further in June 2026 reviews of completed domestic calendars, where late-season midweek games produced more overs outcomes than earlier equivalents despite consistent pre-match totals posted by operators.

What's interesting is how weather data integration into odds models has altered layer behaviour since 2022. Markets now adjust totals layers more aggressively when forecasts predict heavy rainfall for northern European venues, and cross-season comparisons demonstrate these adjustments have become more accurate as meteorological inputs improve. Yet residual discrepancies remain in leagues where drainage systems vary widely between stadiums, producing occasional mismatches between projected and realised scoring rates.
Practical Applications in Domestic Leagues
League schedulers release midweek dates months in advance, giving analysts time to construct baseline layers from prior seasons before new information arrives. One approach involves aligning equivalent matchweeks across campaigns and charting how opening odds differ year on year, then tracking subsequent movements to quantify the impact of rule changes or expanded squads. Data indicates that leagues introducing mid-season breaks have seen reduced variance in midweek layers since the policy took effect, because recovery periods blunt the fatigue signals previously priced into later rounds.
Take one dataset compiled by Canadian sports betting researchers that aligned Premier League, Bundesliga and Serie A midweek fixtures from 2021 onward. The work found that comparative layers for both teams to score narrowed consistently in February rounds relative to August rounds, a pattern persisting across multiple seasons even as overall scoring environments fluctuated. Observers attribute the stability to persistent scheduling features rather than transient team form, underscoring why layered analysis adds context beyond raw statistics.
According to a report published by the Australian Gambling Research Centre, integration of travel distance metrics into odds models has refined expectations for away sides in midweek slots, particularly when journeys exceed 400 kilometres. Layer comparisons across seasons reveal bookmakers have gradually shortened away win probabilities in these scenarios by an average of 4 percentage points since 2023, aligning more closely with observed results.
Conclusion
Layered odds comparisons provide a structured method for isolating seasonal pattern shifts in midweek domestic encounters without relying on isolated match data. By aligning successive market layers from multiple seasons, analysts trace how fixture density, weather inputs and scheduling adjustments reshape probabilities in measurable ways. The approach continues to evolve as data granularity improves, offering clearer visibility into recurring dynamics that single-season reviews often miss.