Tracing Travel Distances and Fixture Congestion Patterns to Refine Midweek Accumulator Structures
Written by Avery Weber · Jul 7, 2026
Tracing Travel Distances and Fixture Congestion Patterns to Refine Midweek Accumulator Structures
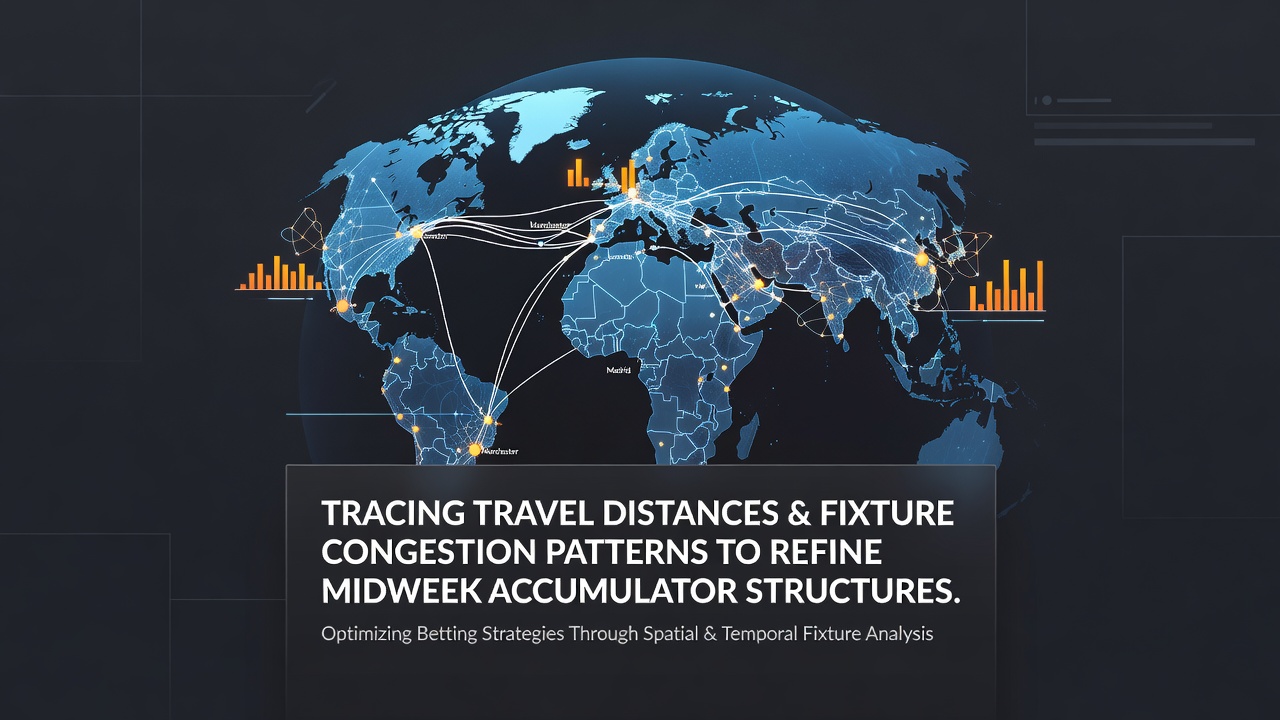
Observers note that midweek football schedules create distinct patterns where distance traveled and match density influence outcomes, and analysts examine these variables to adjust accumulator selections accordingly. Data from across European leagues reveals that clubs often cover thousands of kilometers in short periods when domestic cups and continental ties overlap, which produces measurable effects on recovery times and squad rotation decisions.Mapping Fixture Congestion Across Competitions
European calendars pack fixtures into tight windows each season, particularly from September through December and again in February through April. Teams competing in domestic leagues plus cup ties plus UEFA events face three matches within eight or nine days on multiple occasions, while those with lighter schedules enjoy longer recovery intervals. Researchers at sports performance centers have tracked these clusters and found that repeated high-intensity efforts without adequate rest correlate with elevated injury rates and reduced high-speed running distances in subsequent games. One study published in the International Journal of Sports Physiology and Performance examined Bundesliga and Serie A squads over five seasons and documented a 12 percent drop in total distance covered when teams played three matches in seven days compared with two-match weeks.
Travel Distances and Their Measurable Effects
Long-haul journeys add another layer to congestion analysis. Clubs based in northern Europe traveling to southern or eastern venues often log flights exceeding four hours, followed by time-zone shifts and disrupted sleep patterns. Australian Institute of Sport reports on elite team sports indicate that eastward travel of more than three time zones impairs reaction times and decision-making for up to 72 hours post-arrival. In football contexts, similar patterns appear when Premier League sides visit distant Champions League opponents midweek before returning for weekend league fixtures. Performance databases show away teams that traveled over 2,000 kilometers in the preceding seven days win approximately 8 percent fewer matches than those with shorter journeys during comparable periods.
July 2026 scheduling announcements from several leagues highlight continued clustering around international breaks and expanded European competitions, which analysts expect will maintain these travel and congestion dynamics into the 2026-27 campaign.
Integrating Metrics Into Accumulator Construction
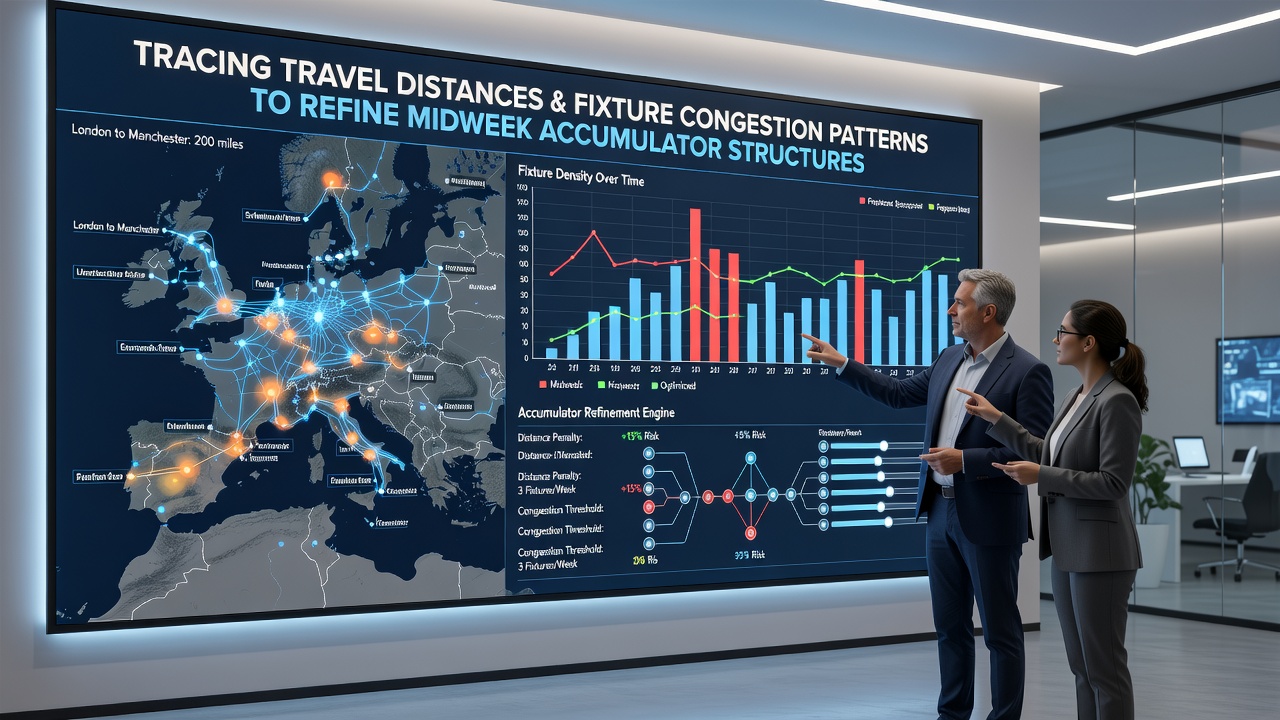
Accumulator builders examine historical data sets that combine travel logs, fixture density, and outcome statistics. They identify squads with favorable rest profiles or minimal long-distance travel when constructing midweek selections. For example, a team returning from a short domestic trip with four days between matches often demonstrates higher expected goal outputs than one arriving from a continental fixture with only two days recovery. External datasets from Opta and similar providers allow comparison of these variables across multiple leagues simultaneously, enabling cross-league accumulator combinations that account for both congestion and distance factors.
Case Examples From Recent Seasons
Take one researcher who reviewed 2024-25 midweek rounds and isolated instances where fixture congestion aligned with long travel. In one cluster, four English clubs journeyed more than 1,800 kilometers each for Europa League ties before hosting league opponents; their combined win rate dropped to 31 percent in those follow-up matches. Conversely, sides with lighter midweek obligations posted win percentages above 52 percent when facing the same congested opponents. Observers tracking Serie A and La Liga data noted parallel trends, where distance traveled correlated with reduced shot conversion rates in the subsequent 72 hours. These patterns repeat across seasons, giving data analysts repeatable inputs for refining accumulator structures rather than relying solely on form or head-to-head records.
Adjusting Selections Based on Recovery Indicators
Advanced models incorporate variables such as kilometers traveled, number of matches in the prior 14 days, and average rest hours between fixtures. When these indicators exceed established thresholds, model outputs assign lower probabilities to the affected teams in accumulator legs. Conversely, teams operating below congestion thresholds receive adjusted weightings that reflect their historical outperformance in such windows. Industry reports from the European Club Association confirm that medical and performance staff increasingly share anonymized recovery data with analysts, which sharpens these threshold calculations season after season.
Conclusion
Patterns linking travel distances and fixture congestion to performance shifts provide concrete inputs for refining midweek accumulator structures. By cross-referencing league schedules, flight records, and outcome databases, analysts construct selections that align with measurable recovery advantages rather than surface-level narratives. Continued expansion of European competitions into 2026 maintains the relevance of these variables for those structuring accumulators across multiple midweek rounds.