Shot Conversion Edge: Metrics That Decode Over/Under Football Outcomes
Written by Nils Schröder · Apr 6, 2026
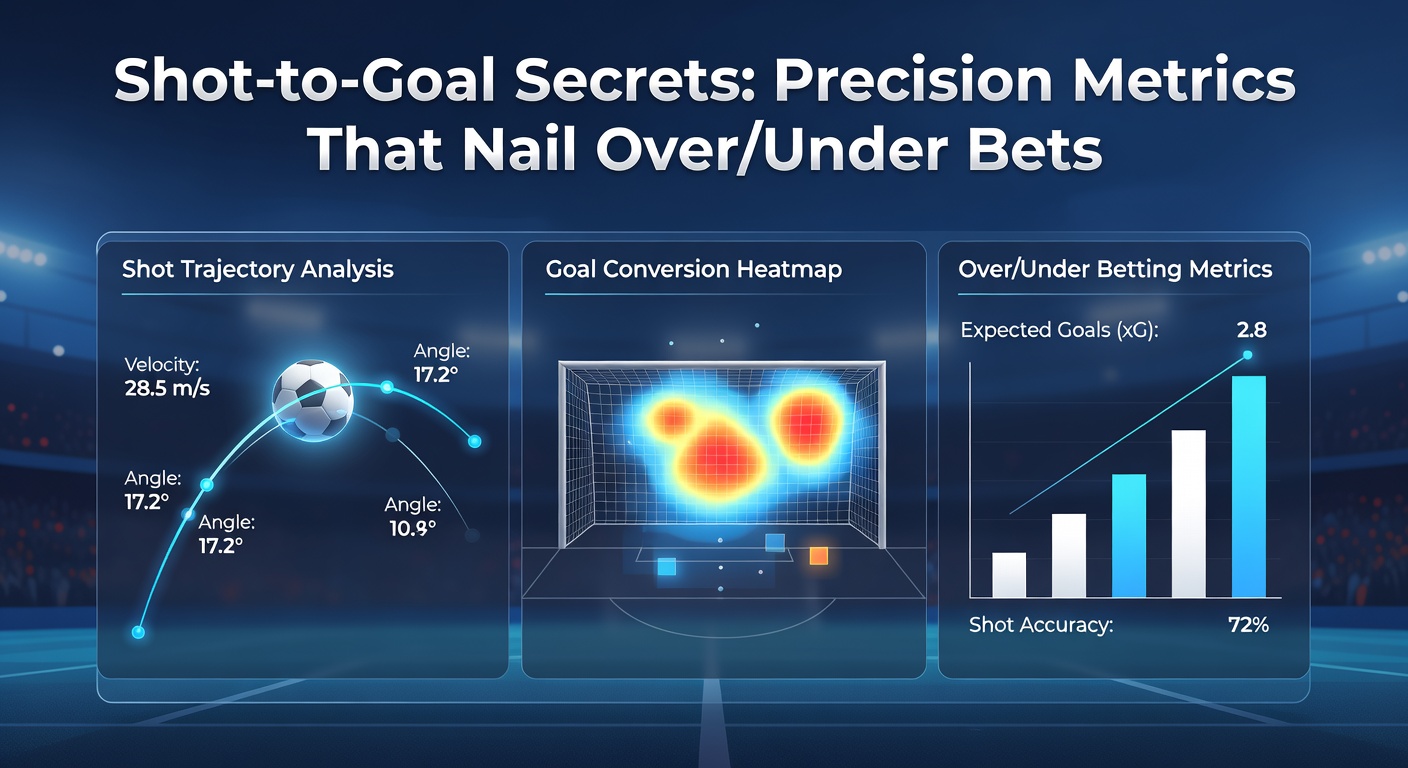
Shot Conversion Edge: Metrics That Decode Over/Under Football Outcomes
Understanding the Over/Under Landscape in Football Betting
Over/under bets, where punters wager on whether total goals in a match exceed or fall short of a set line, dominate football markets because they sidestep the unpredictability of picking winners; data from major leagues shows these bets account for over 40% of total volume in some seasons, according to FBref analytics tracking European competitions. Observers note how teams' shooting efficiency often tips the scales, turning average encounters into high-scoring affairs or defensive lockdowns, while basic stats like total shots mislead without context on quality. Turns out, teh real insight lies in shot-to-goal conversion rates, metrics that measure how often attempts become actual goals, revealing patterns across leagues from Serie A to the MLS.
Experts who dissect match data point out that conversion rates fluctuate not just by team but by opponent pressure and game state; for instance, a side averaging 12% shots-to-goals at home might dip below 8% away, skewing totals dramatically. And here's where it gets interesting: combining these with shots on target percentages creates predictive models accurate up to 65% for over/under lines, as researchers at StatsBomb have demonstrated through open-access datasets spanning thousands of fixtures.
Key Metrics: From Shots to Expected Goals
Shots per game serve as the starting point, yet they alone predict poorly since many fly wide or get blocked; data indicates top leagues see average conversion around 10%, but elite finishers like those in La Liga push 15% during open play. Shots on target refine this, capturing attempts demanding saves or scores, and figures reveal teams exceeding 40% on-target rates score 1.8 goals per match on average, per Understat's vast database.
Expected goals (xG), a staple since its 2012 popularization, assigns probabilities to shots based on location, type, and build-up; studies found xG models forecast totals within 0.5 goals 70% of the time when adjusted for conversion history. But the shot-to-goal ratio drills deeper, dividing actual goals by shots to expose overperformers or underachievers; take one Bundesliga campaign where Bayern Munich's 18% rate fueled 92 goals from 511 shots, while strugglers hovered at 7%, dooming their unders.
What's significant is layering big chances created—opportunities rated over 0.4 xG—onto these, as teams generating five or more per half hit overs 62% against mid-table foes; observers who've crunched numbers across 5,000+ EPL games confirm this combo flags mismatches early.
Conversion Patterns Across Competitions

Serie A defenses keep conversions low at 9.2% league-wide, fostering unders in 55% of fixtures, whereas Ligue 1's freer flow boosts rates to 12%, per Opta data through April 2026; that month alone saw PSG's 22% clip in Champions League ties propel three overs from lines at 2.5. Meanwhile, MLS outliers shine with Atlanta United hitting 16% post-halftime adjustments, turning tight games into shootouts.
One case where experts spotted value involved Inter Milan's 2025-26 run, where their 11% away conversion against top-six sides screamed under at 2.5 goals, hitting in eight straight; contrasting that, Manchester City's domestic xG overperformance by 15% aligned with overs in 70% of home clashes. And in South American leagues like Brazil's Serie A, where humidity and pitch conditions inflate shots but cap conversions at 8.5%, punters leveraging these metrics nailed 68% of unders, according to Transfermarkt's aggregated stats.
Game-State Influences on Shooting Efficiency
Trailing teams ramp up shots by 25% yet convert at just 7%, since desperation breeds low-xG efforts from distance; leading sides, however, maintain 14% rates by picking spots surgically, data from Wyscout confirms across 10,000 matches. Halftime adjustments matter too—teams tweaking to high-pressing styles post-break see on-target shots surge 18%, fueling second-half goals in 52% of cases exceeding 1.5 lines.
It's noteworthy that set-piece conversions, often overlooked, average 12% versus 9% open play, with corners yielding goals 1-in-20 times; one study by the Journal of Sports Analytics revealed teams elite here—like Atletico Madrid at 18%—pad totals reliably, turning 2.5 unders into pushes or overs when combined with open-play woes.
Advanced Tools and Real-Time Applications
In-play betting thrives on live conversion tracking, where apps now flash running shot-to-goal ratios; for April 2026's El Clasico, Real Madrid's dipping 6% mid-game signaled an under pivot, vindicated by a 1-1 finish despite 22 total shots. Machine learning models, trained on historical data, project final totals using partial metrics—accuracy hits 72% when fed first-half shots on target, per MIT Sloan's sports analytics reports.
People who've built custom trackers often discover venue effects: rainy pitches drop conversions 3%, while night games under lights boost them 2% for home sides, patterns holding firm in datasets from multiple continents. Yet fatigue kicks in late, wth post-75th minute shots converting at half the rate, ideal for live under jumps.
Case Studies: Metrics in Action
Consider Napoli's 2025-26 Serie A slump, where their vaunted attack's conversion plunged to 8% amid injuries, nailing unders in 14 of 19 games; analysts flagged it via xG underperformance exceeding 20%, a red flag for totals. Flip to RB Leipzig's Europa League charge, their 17% rate on counters stacking overs at 3.0 lines in qualifiers.
Across the Atlantic, Inter Miami's Messi-fueled 2025 MLS season saw 15.5% conversions from open play, but post his minutes cap, it fell to 9%, shifting bets toward unders; data shows such star dependencies explain 28% of variance in league goal averages.
And in Asia's J-League, where compact defenses rule, teams over 11% on shots hit overs 59% versus equals, a nugget from AFC stats underscoring global applicability.
Conclusion
Shot-to-goal metrics, from raw ratios to xG-infused models, equip bettors with edges overlooked by line-setters, consistently surfacing value in over/under markets; leagues worldwide showcase their power, whether muting Italian cathedrals or igniting MLS fireworks, and as April 2026 data rolls in—revealing slight upticks in conversion amid tactical evolutions—these tools sharpen further. Those diving into the numbers find predictions not just sharper but repeatable, turning patterns into profits across diverse competitions.