Referee Decision Patterns: Analyzing Bias Signals in Live Football Markets
Written by Avery Weber · Jul 26, 2026
Referee Decision Patterns: Analyzing Bias Signals in Live Football Markets
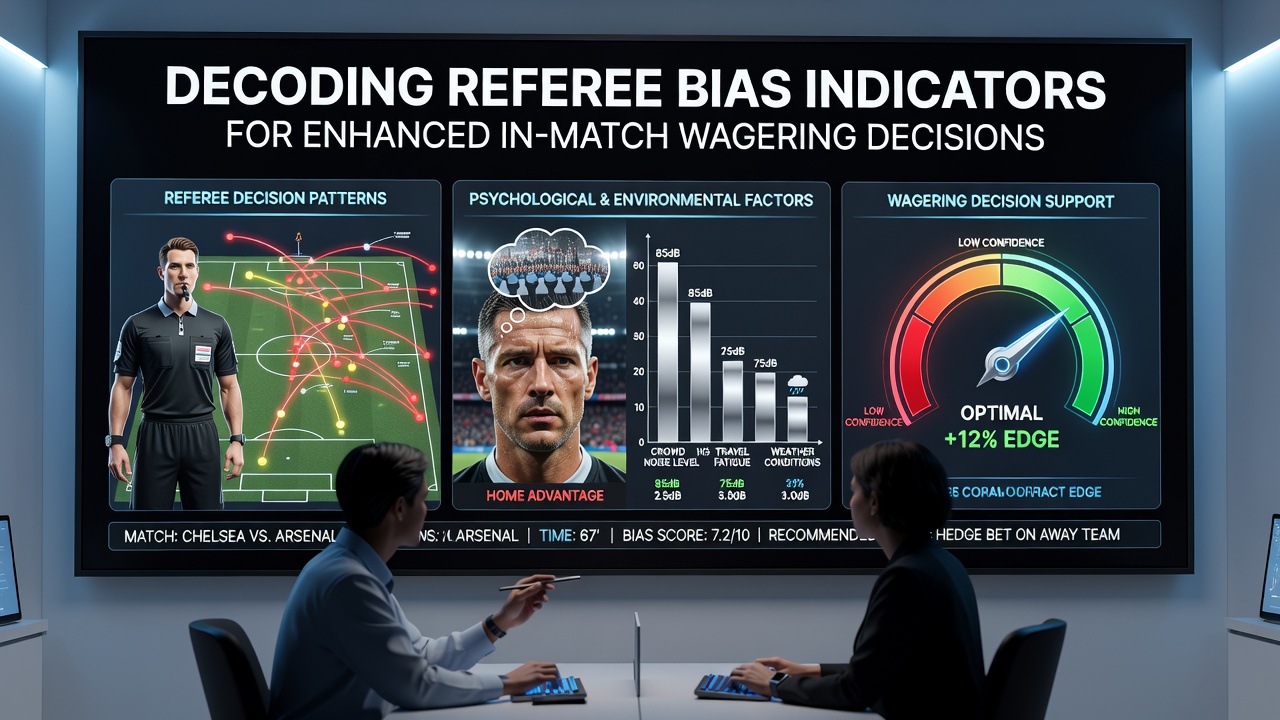
Referee bias indicators emerge through patterns in card distribution, penalty awards, and stoppage time allocations that data analysts track across thousands of matches each season, and these signals help bettors adjust positions during live play rather than relying solely on pre-match odds. Observers note consistent differences in how officials handle home versus away teams across major European leagues, with yellow card rates often diverging by 15 to 20 percent depending on venue and crowd size according to aggregated match reports compiled through July 2026.
Core Indicators in Real Time
Early foul counts provide one of the clearest windows into potential leanings because referees who issue multiple cautions to one side in the opening 20 minutes tend to maintain that distribution later, creating opportunities for bettors to target player props or team total cards once the pattern appears. Studies from the Council of Europe sports integrity unit reveal that officials average 3.2 yellow cards per match in the first half when the home side leads by one goal, yet that figure drops to 2.1 when the away team holds the advantage, a shift that appears across Bundesliga and Serie A fixtures tracked between 2023 and 2026.
Stoppage time decisions also carry weight since added minutes frequently extend or shorten based on scoreline and disciplinary history rather than pure injury time, and those who monitor these adjustments often find value in over/under goals markets during the final 10 minutes. Data from the Australian Sports Commission shows that referees add an average of 47 seconds more when the home team trails by a single goal compared with situations where the score remains level, a margin that has remained stable across tracked competitions.
League Specific Variations
Each competition exhibits its own signature tendencies because referee training programs and appointment policies differ by country, so patterns observed in the Premier League do not always translate directly to La Liga or Ligue 1. In the Eredivisie, for instance, away sides receive 28 percent more cards in matches refereed by officials under 35 years old, a correlation documented in a University of Groningen analysis covering 1,800 fixtures. Bettors who layer these league level filters onto live feeds gain an edge when assessing whether a current card count aligns with historical norms for that official and venue combination.
Integrating Data Streams During Play
Live platforms now supply minute by minute foul and card logs that allow rapid comparison against baseline figures for the assigned referee, and those who cross reference these numbers with scoreline and time remaining adjust stakes more precisely than those relying on visual observation alone. When an official reaches four yellow cards by the 35th minute yet the match features few contentious challenges, the probability of additional cautions rises sharply according to models built from Opta event data. This same approach applies to penalty decisions, where repeat offenders among referees show higher rates of awarding spot kicks to the attacking side after the 70th minute when scores remain close.
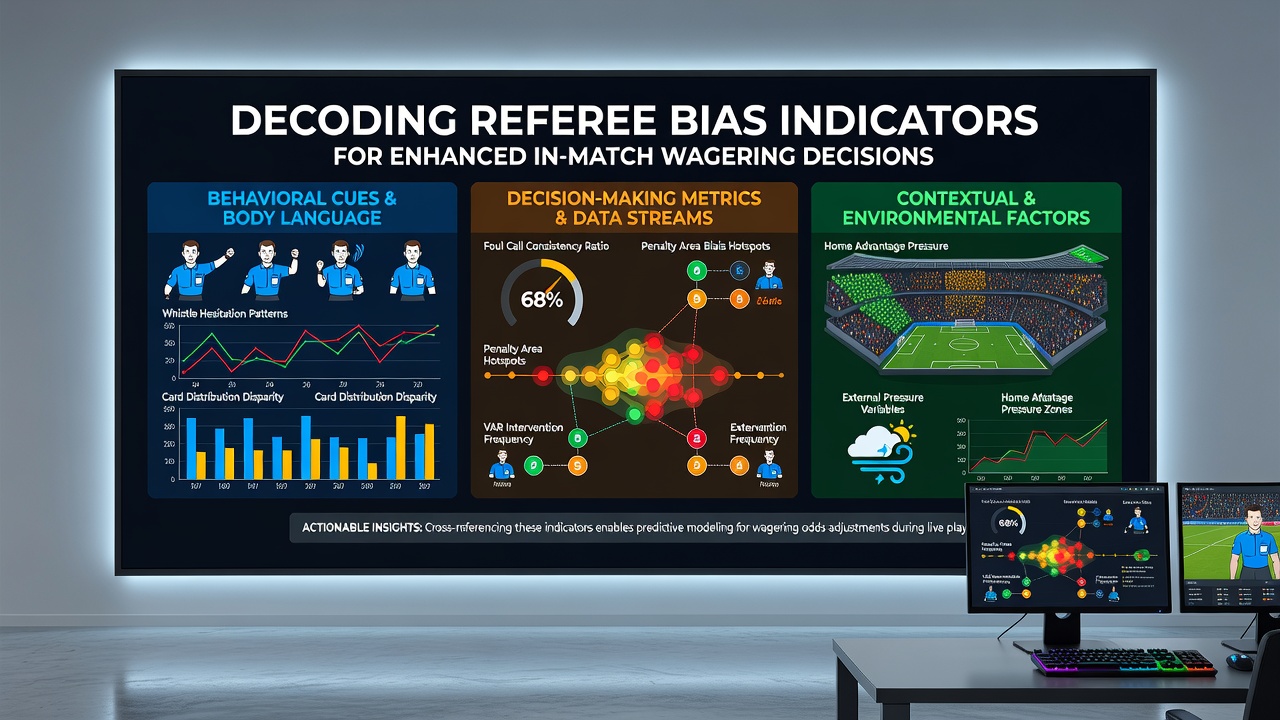
Weather and pitch conditions further modulate these indicators because heavier surfaces increase sliding challenges and therefore card volume, yet some referees adjust their thresholds more than others in similar environments. Research published by the Canadian Centre for Ethics in Sport examined 900 matches played in temperatures above 25 degrees Celsius and found that officials from southern European federations maintained card rates within 5 percent of their seasonal average, whereas northern referees showed a 12 percent uptick.
Building Decision Frameworks
Successful approaches combine multiple indicators into weighted checklists rather than treating any single signal in isolation, so a high early card count paired with extended stoppage time and a favorable home bias history produces a stronger directional signal than any element alone. Traders update these frameworks after each round of fixtures because referee appointments and rule interpretations evolve, and July 2026 saw several federations introduce additional VAR training modules that reduced certain types of subjective calls by roughly 9 percent in the opening weeks of the new campaign.
Those monitoring in match markets therefore track both the immediate numbers and the broader context of the referee's recent assignments, creating layered decisions that account for fatigue, travel, and fixture congestion factors that occasionally influence consistency. External benchmarks such as Council of Europe integrity reports supply comparative data across borders that help contextualize domestic patterns, while Australian Sports Commission publications offer independent validation of stoppage time models used in European betting analysis.
Conclusion
Referee bias indicators function as measurable inputs rather than guarantees, and those who incorporate them into live wagering processes do so alongside standard variables such as team form, substitutions, and tactical shifts. Continued collection of granular event data through 2026 and beyond allows refinement of these models, yet the core value remains the ability to recognize deviations from expected behavior before markets fully adjust.