How Overloaded Match Schedules Reshape Performance Indicators in Sports Wagering Models
Written by Willa Roth · Jun 2, 2026
How Overloaded Match Schedules Reshape Performance Indicators in Sports Wagering Models
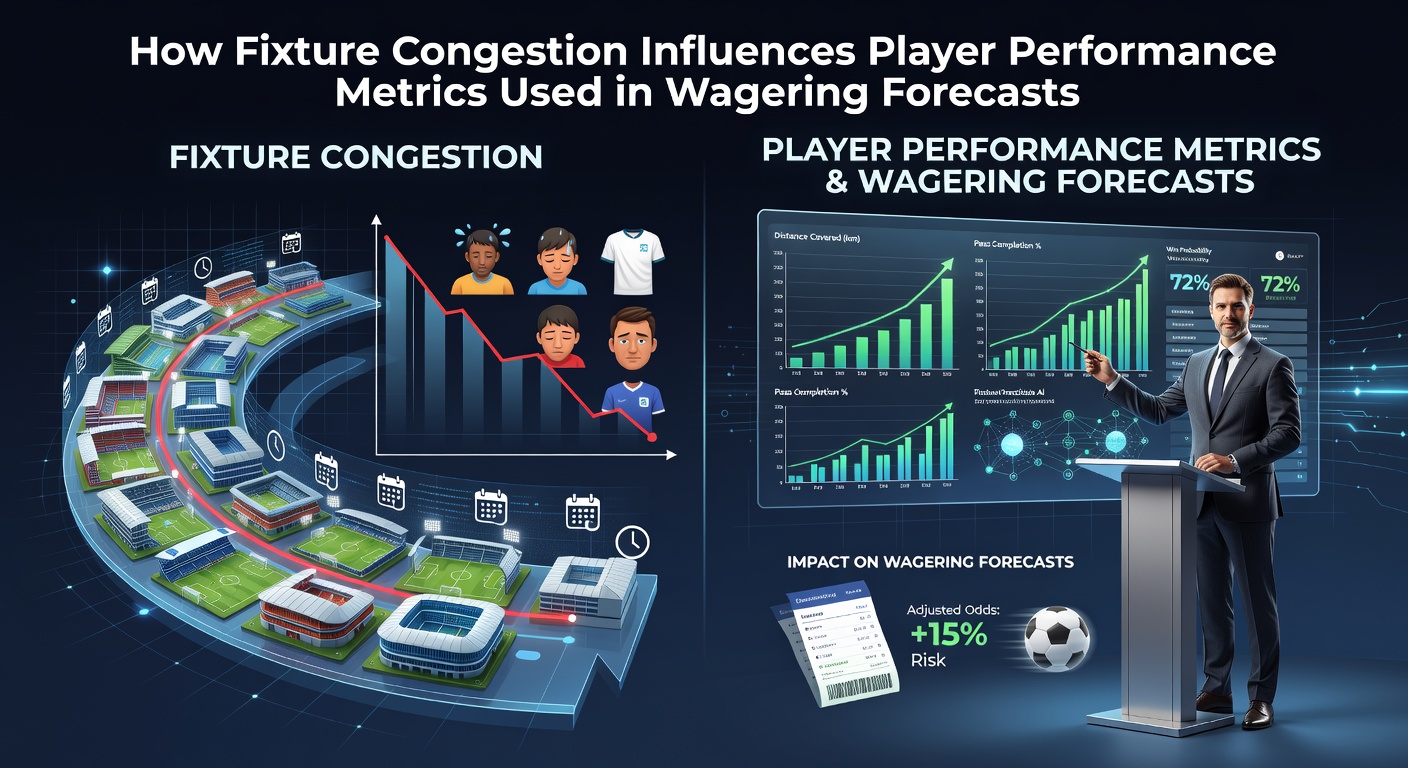
Fixture congestion occurs when teams face multiple matches within short timeframes, often spanning domestic leagues, cup competitions, and international windows, and analysts track its effects on measurable outputs such as total distance covered, high-intensity sprints, and recovery heart rates. Data from sports science monitoring systems show that players typically experience a measurable decline in physical capacity after three or more games in a ten-day period, with average reductions in high-speed running reaching 8 to 12 percent according to aggregated GPS datasets compiled across European competitions.
Physical Metrics Under Pressure
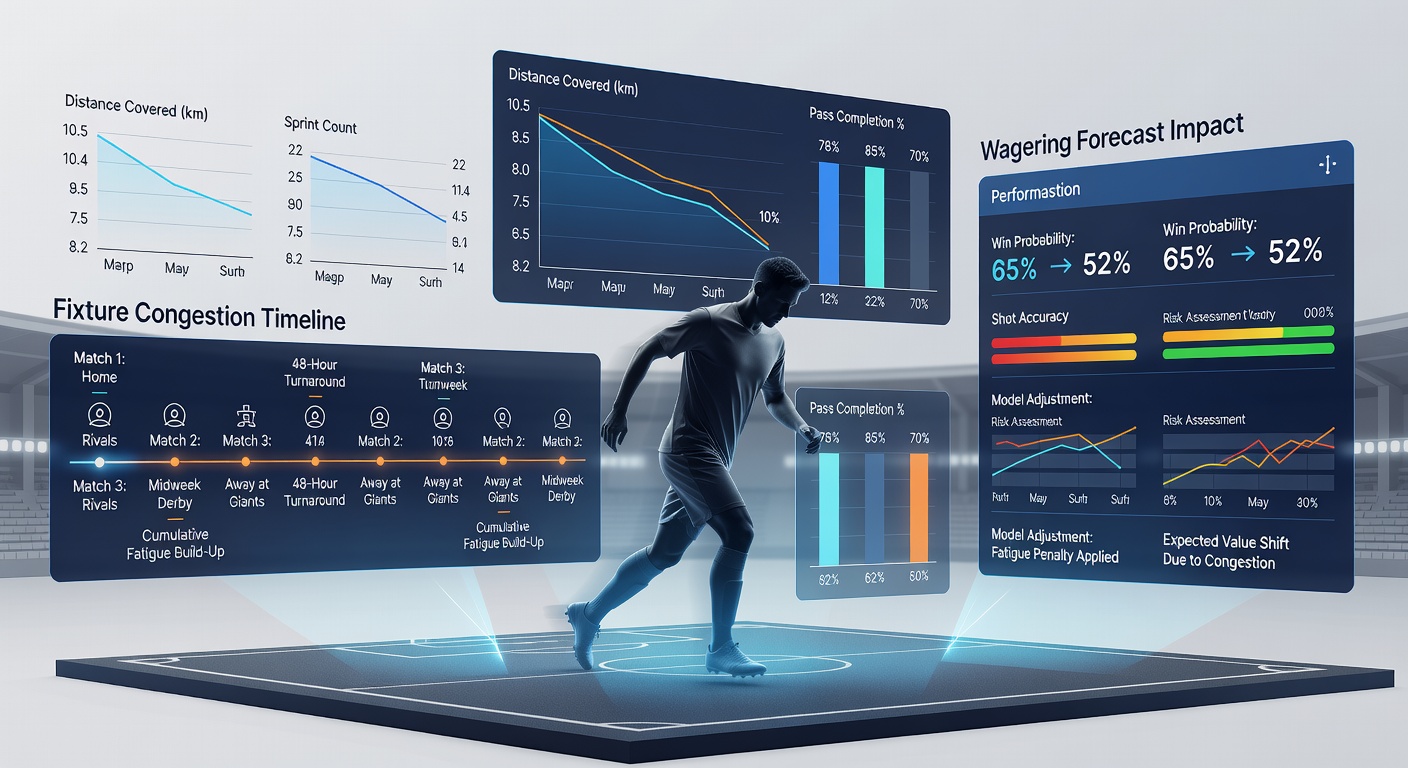
Accelerometer and GPS technology records clear shifts once recovery windows shrink below 72 hours, including lower peak velocities and fewer explosive accelerations per 90 minutes, while heart-rate variability readings indicate incomplete autonomic recovery in many athletes. Researchers at academic institutions have documented these patterns through longitudinal studies that compare congested versus non-congested schedules, revealing consistent drops in total distance covered that directly feed into player-prop betting models used by forecasting platforms. Those who monitor elite-level data note that central midfielders often register the steepest declines because their positional demands combine high aerobic loads with frequent directional changes.
Technical and Tactical Adjustments
Pass completion percentages and duel win rates also fluctuate under fatigue, though the direction of change varies by position and team style, with some squads compensating through shorter passing networks that maintain possession at the cost of progressive carries. Optically tracked event data demonstrate that progressive pass attempts decrease by roughly 15 percent in the third match of a congested block, a figure that model builders incorporate when projecting expected goals and assists for individual player markets. Technical staff adjust training loads accordingly, yet the cumulative effect still surfaces in match statistics that betting forecasts rely upon for calibration.
Integration Into Wagering Forecasts
Algorithmic models ingest these adjusted metrics to recalibrate probabilities for over/under markets on player shots, tackles, and distance-based props, while bookmakers update their pricing engines with rolling averages that weight recent congested fixtures more heavily. Observers note that variance in these inputs widens during peak periods such as December and April, prompting wider margins in live betting interfaces until fresh data streams arrive. A 2025 analysis published by the International Journal of Sports Physiology and Performance quantified how such metric drift alters implied probabilities by 4 to 7 percentage points in select player performance lines.
June 2026 scheduling data released by continental confederations already highlight similar compression ahead of expanded club tournaments, with several squads facing five matches across 18 days immediately following national team breaks. Forecasting services incorporate these calendars early, layering historical congestion coefficients onto current squad depth charts to refine projected outputs. External benchmarks from the Australian Institute of Sport further illustrate that similar patterns appear in other high-frequency team sports, providing cross-domain validation for the weighting schemes employed in football-specific models.
Positional and Squad-Level Variations
Wide forwards tend to preserve sprint metrics longer than central defenders because their workload distribution favors shorter bursts rather than sustained coverage, yet their shot-creation numbers still drop once cumulative fatigue accumulates. Squad rotation strategies mitigate some effects, but data show that even rotated players exhibit elevated error rates in high-stakes duels during the second half of congested sequences. Modelers therefore apply position-specific decay functions that adjust baseline expectations before generating final forecast distributions.
Conclusion
Performance metrics collected during congested periods supply essential inputs for wagering forecasts, allowing quantitative adjustments that reflect documented physiological and technical shifts. Continued expansion of tracking technology and denser fixture calendars ensure these relationships remain central to prediction accuracy across markets that rely on granular player and team outputs.