Examining Payout Disparities Between Betting Platforms to Optimize Accumulator Selections
Written by Henrik Lang · Jun 21, 2026
Examining Payout Disparities Between Betting Platforms to Optimize Accumulator Selections
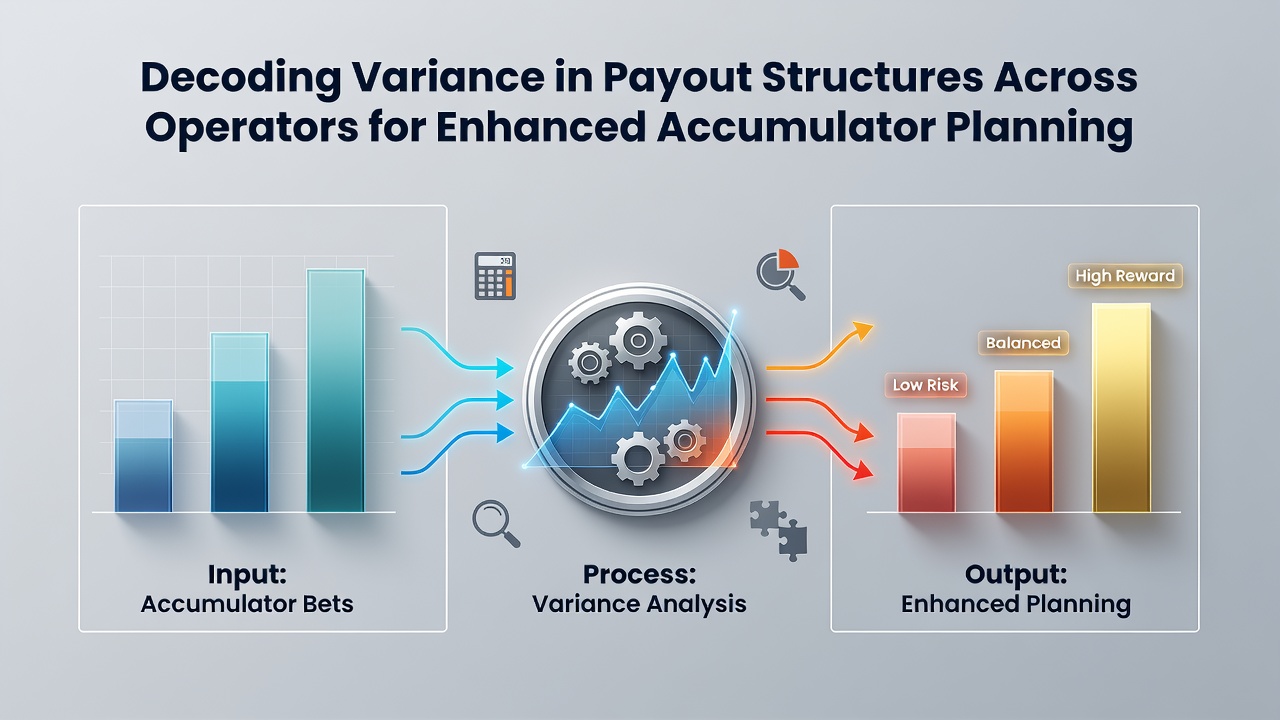
Operators in the betting sector maintain distinct payout structures that create measurable differences in returns for accumulator bets, and those differences stem from variations in margin calculations, odds compilation methods, and risk management approaches. Research indicates these structures influence how bettors can plan multi-leg selections because each platform applies its own overround percentages and adjustment algorithms that shift final odds on the same events.
Data from regulatory filings shows margins typically range between 2 and 8 percent depending on the operator and market type, while accumulators amplify those margins through multiplication across legs. Observers note that platforms with tighter margins on individual selections still produce lower combined payouts when the number of legs increases, whereas others offset higher single-event margins with occasional promotions that temporarily reduce effective variance.
Core Components of Payout Variance
Three primary factors drive the differences operators display in their accumulator offerings, and each factor interacts with the others in ways that affect planning strategies. Margin application comes first because every bookmaker builds an overround into quoted odds, yet the distribution of that overround across football, tennis, and basketball markets varies widely. Some platforms concentrate margin on popular leagues while keeping niche markets closer to true probability, which creates opportunities for accumulators that mix event types.
Odds compilation methods form the second factor, and these methods range from fully automated models that update in real time to hybrid systems where traders intervene during high-volume periods. Automated systems tend to produce more consistent variance across similar events, whereas human-adjusted lines introduce occasional spikes or dips that experienced planners track through historical data sets. Risk management policies represent the third factor because operators set maximum payout caps and stake limits that directly constrain accumulator size, and those caps differ by jurisdiction and operator size.
Regional Regulatory Influences on Structure
Regulatory environments shape payout structures more than many realize, and data collected by the International Association of Gaming Regulators demonstrates how licensing requirements in different countries force operators to maintain specific reserve levels and transparency standards. European frameworks emphasize consumer protection disclosures that reveal margin ranges, while North American state-level rules focus on tax allocation formulas that indirectly affect the amounts operators can return. Australian oversight bodies require regular reporting on payout percentages, and those reports reveal seasonal patterns where margins tighten during major tournaments and widen during quieter periods.
Those who've analyzed filings from multiple jurisdictions find that operators licensed in stricter environments often display lower variance in accumulator returns because they must publish standardized formulas, yet the same operators may restrict market availability to control exposure. Platforms operating under lighter frameworks retain more flexibility to adjust margins quickly, which produces wider swings in payout percentages from week to week.
Practical Planning Approaches for Accumulators
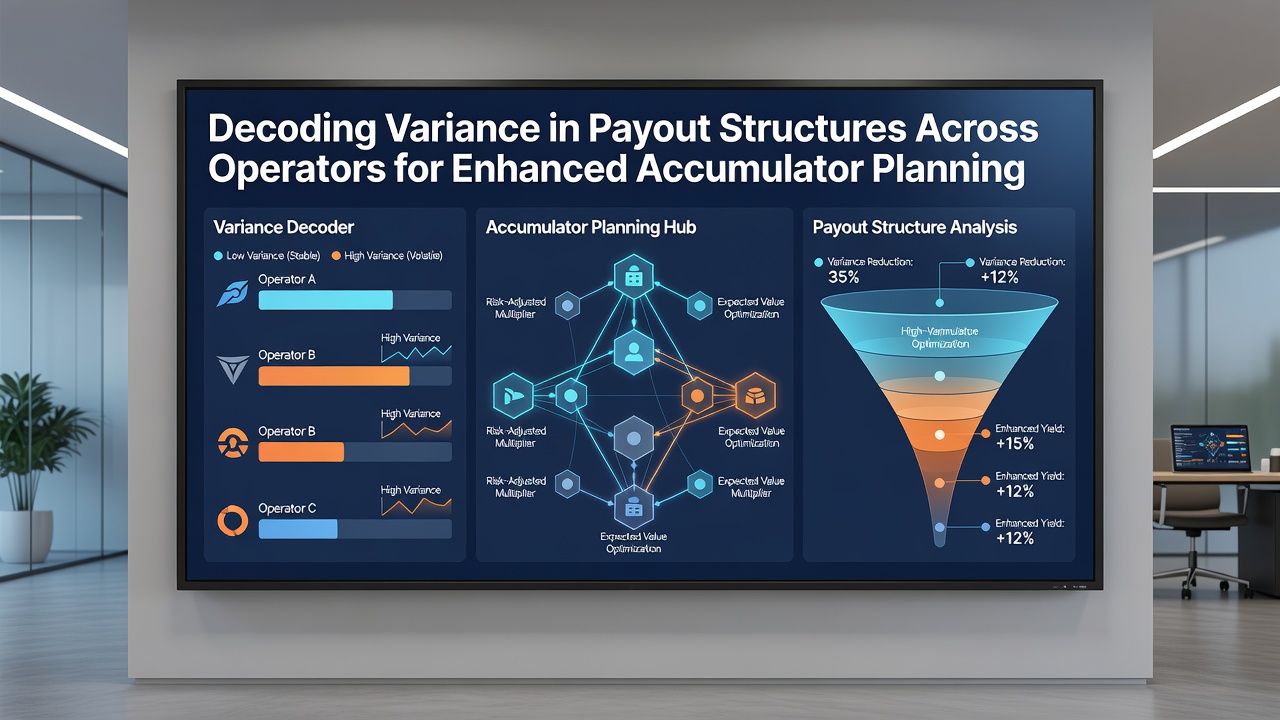
Planners who compare structures across operators often begin by compiling historical payout data for repeated event combinations, and that comparison reveals which platforms consistently return higher percentages on three-leg and five-leg accumulators. Software tools that aggregate odds from multiple sources allow users to identify the tightest margins for each leg before combining them, and this process reduces the cumulative effect of variance. Some operators publish weekly margin reports that planners incorporate into spreadsheets to forecast expected returns over larger sample sizes.
Stake distribution across platforms represents another technique because spreading selections reduces the impact of any single operator's payout cap. Those who maintain accounts with several operators can route individual legs to the platform offering the best odds for that specific market, and this segmentation lowers overall variance while preserving the accumulator format. June 2026 data releases from multiple international regulators are expected to provide updated margin statistics that will allow planners to recalibrate their models after the current season concludes.
Technology and Data Integration
Modern planning incorporates API feeds that pull real-time odds and historical payout records, and these feeds enable comparison engines to flag operators whose structures deviate from sector averages. Machine learning models trained on past accumulator outcomes can predict periods when variance spikes, such as during injury reporting windows or when major roster changes occur. Observers note that platforms investing heavily in algorithmic pricing tend to exhibit lower day-to-day variance, which benefits planners seeking consistency over longer time horizons.
Yet integration requires attention to data latency because delayed feeds can cause selections to lock at outdated odds, and that latency introduces its own variance layer. Operators that provide direct API access with sub-second updates give planners an edge when constructing time-sensitive accumulators that span multiple time zones.
Conclusion
Decoding payout variance across operators requires systematic collection of margin data, regulatory filings, and historical return records, and this information supports more precise accumulator construction. Platforms differ in how they distribute margins, compile odds, and apply risk controls, so planners who track those differences gain measurable advantages in expected returns. Continued regulatory reporting and technological improvements in data access will further refine the tools available for optimizing multi-leg strategies across the sector.