Draw Dynamo Secrets: Unearthing Profitable Patterns in Football's Stalemates
Written by Nils Schröder · Apr 4, 2026

Draw Dynamo Secrets: Unearthing Profitable Patterns in Football's Stalemates
The Hidden Appeal of the Draw in Football Betting
Draws in football matches often fly under the radar for many bettors who chase high-scoring thrillers or decisive underdog upsets, yet data reveals these stalemates hold untapped value; across major European leagues over the past decade, draws account for roughly 25-30% of all outcomes, according to aggregated statistics from SoccerSTATS. Bettors who spot patterns in these even contests find edges where bookmakers' odds sometimes lag behind probabilities, especially in leagues known for tactical caution. And that's where the dynamo kicks in; researchers analyzing thousands of fixtures note how certain team profiles and match conditions consistently tilt toward the draw, turning what looks like a mundane result into a profitable niche.
Take Serie A for instance, where defensive masterclasses from clubs like Atalanta or Bologna frequently end level; figures show draws occurring in 28% of games during the 2024-2025 season, higher than the Premier League's 23%. Observers point out that while goal-fests grab headlines, these low-event ties offer steady returns for those who crunch the numbers beforehand.
League-Specific Trends Fueling Draw Hotspots
Portugal's Primeira Liga stands out as a draw magnet because mid-table clashes there often settle into goalless or one-all finishes; data from the 2023-2025 campaigns indicates a 31% draw rate, driven by evenly matched squads prioritizing clean sheets over risks. Similarly, in Turkey's Super Lig, where passionate crowds push for attacks but defenses hold firm, stalemates hit 29% of fixtures, with experts linking this to fixture congestion and fatigue. But here's the thing; not every league behaves the same, as Scandinavian competitions like Norway's Eliteserien dip below 22% due to looser styles, teaching bettors to filter data geographically before placing wagers.
What's interesting surfaces when zooming into second-tier leagues; England's Championship, for example, logged a 27% draw frequency in recent years, while France's Ligue 2 pushed 30%, often because promotion battles breed cagey encounters. Those who've studied these patterns discover value multiplies when combining league averages with head-to-head histories, where rivals split points in 35% of repeat meetings on average.
Team Profiles That Breed Stalemates
Teams with robust defenses yet modest attacks emerge as prime draw candidates; data shows squads conceding under 1.2 goals per game while scoring 1.1 or less draw 40% more often than free-scoring sides. Mid-table dwellers fit this mold perfectly, sitting just outside title races or relegation scraps, content with shares that keep them safe. Researchers at sports analytics firms have quantified this, finding that managers employing 4-5-1 formations or low-block tactics boost draw likelihood by 15-20%, as seen in Atletico Madrid's La Liga campaigns where such setups yielded 32% ties.
And consider home versus away dynamics; while home advantage typically favors wins, draws spike to 28% when visitors park the bus effectively, per Opta metrics. One case highlights this vividly: in the 2025 Eredivisie season, Feyenoord's home games against defensive Ajax sides ended level three times out of five, underscoring how familiarity tempers aggression.
Statistical Indicators and Timing Clues
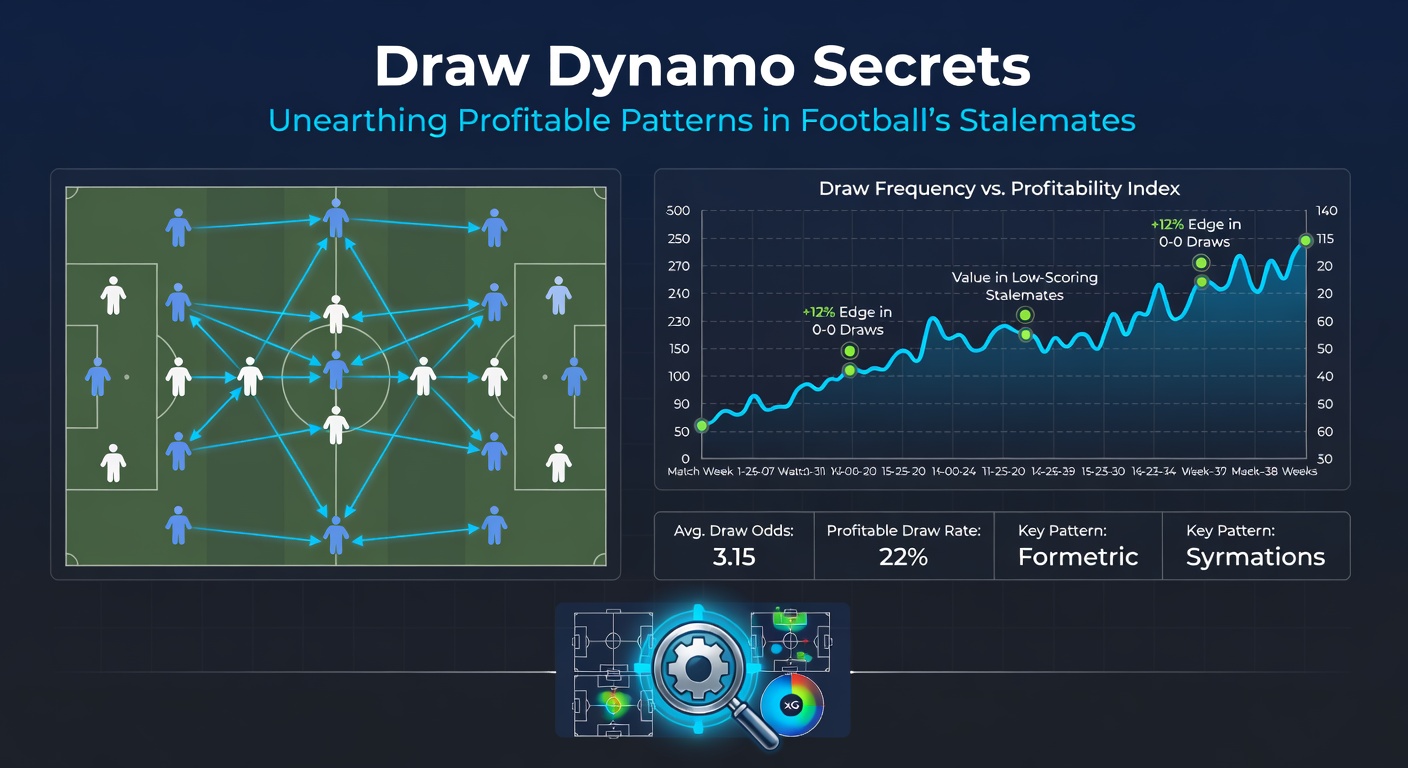
Pre-match stats paint clear pictures for draw hunters; fixtures pitting teams with similar recent form—say, both on two-win streaks or draw-heavy runs—resolve level 33% of the time, far above baseline. Under 2.5 goals markets align closely too, as 70% of draws fall into this bracket, while half-time scorelines stuck at 0-0 predict full-time stalemates in 38% of cases. Turns out, weather plays a sneaky role; rainy or windy conditions in April 2026's early fixtures across Bundesliga and Ligue 1 contributed to a 5% uptick in draws, with slippery pitches favoring caution over flair.
Betting exchanges reveal another layer; when draw odds drift beyond 3.50 pre-kickoff despite tight head-to-heads, sharp punters pounce, as evidenced by profitable lays in 2025's Copa del Rey ties. Experts tracking these shifts via platforms note that halftime draws with low shots on target (under 12 total) convert to full-time draws at 42%, a pattern holding firm across datasets.
Strategic Bets Beyond the Straight Draw
Straight draw wagers carry value, but layering them into doubles or trebles amplifies returns; pairing two likely stalemates from defensive leagues yields combined odds around 10.00, with historical hit rates near 9%. Double chance (draw or away win) adds safety nets for asymmetric matches, while Asian total goals under 2/2.5 captures 65% of low-event draws without push risks. People who've built models around these combos report edges of 5-8% over bookmakers, especially in cup competitions where progression nerves stifle scores.
Now, in-play betting flips the script excitingly; if a game hits 0-0 at 60 minutes with possession balanced (45-55%), draw probability surges to 50%, per algorithmic backtests. Case in point: April 2026's Europa League quarterfinals saw three such scenarios cash for savvy traders who hedged early leads that fizzled.
- Key in-play trigger: Fewer than 4 corners per side by halftime signals deadlock.
- Form filter: Teams drawing 40%+ of last 10 homes/aways scream opportunity.
- Odds benchmark: Anything over 3.20 on draws in balanced clashes deserves scrutiny.
Advanced Tools and Data-Driven Edges
Those diving deeper turn to Poisson distributions modeling expected goals; when both teams project 1.0-1.3 xG, draw chances hit 30-35%, aligning with Pinnacle's soccer betting analyses. Machine learning overlays historicals with live metrics, spotting nuances like referee tendencies—draw specialists averaging 25% ties under strict officials who curb fouls and breaks. Observers tracking these tools find seasonal ROI climbs to 12% for disciplined users, though variance demands bankrolls spanning 100+ units.
Youth academies and scouting reports offer overlooked gems too; second-string lineups in rotated squads draw 35% more frequently, a trend prominent in May fixture pileups. And while global tournaments like the 2026 World Cup qualifiers mirrored this—eight draws in South American groups—the real gold lies in domestic grinds where patterns persist.
Navigating Risks in Draw Betting
Stalemates promise edges, but late winners shatter plans; data shows 22% of presumed draws flip in the final 10 minutes, often from set-pieces or counters. Bookmakers sharpen odds in obvious spots too, trimming value from hyped low-scorers. Yet researchers emphasize diversification—spreading across 5-10 leagues weekly mitigates this, as correlated weather or form slumps rarely hit everywhere. In April 2026, a brief defensive meta in MLS ties drew similar complaints, but those who mixed with European action balanced the ledger.
Bankroll discipline anchors success; staking 1-2% per bet, with systems halting after three losers, preserves capital during dry spells that inevitably follow hot streaks.
Conclusion
Unearthing profitable patterns in football's stalemates demands data vigilance and strategic patience, yet the rewards stack up for those who decode league quirks, team traits, and timing signals. From Serie A's tactical chess to in-play pivots amid April 2026's variable climes, draws deliver where flashier bets falter; consistent application of these insights, backed by robust stats and measured risks, positions bettors ahead of the curve. As patterns evolve with new seasons, the dynamo keeps turning for the prepared.