Beyond Basic Stats: Integrating Travel Fatigue Factors into Match Outcome Projections
Written by Nils Schröder · Jul 21, 2026
Beyond Basic Stats: Integrating Travel Fatigue Factors into Match Outcome Projections
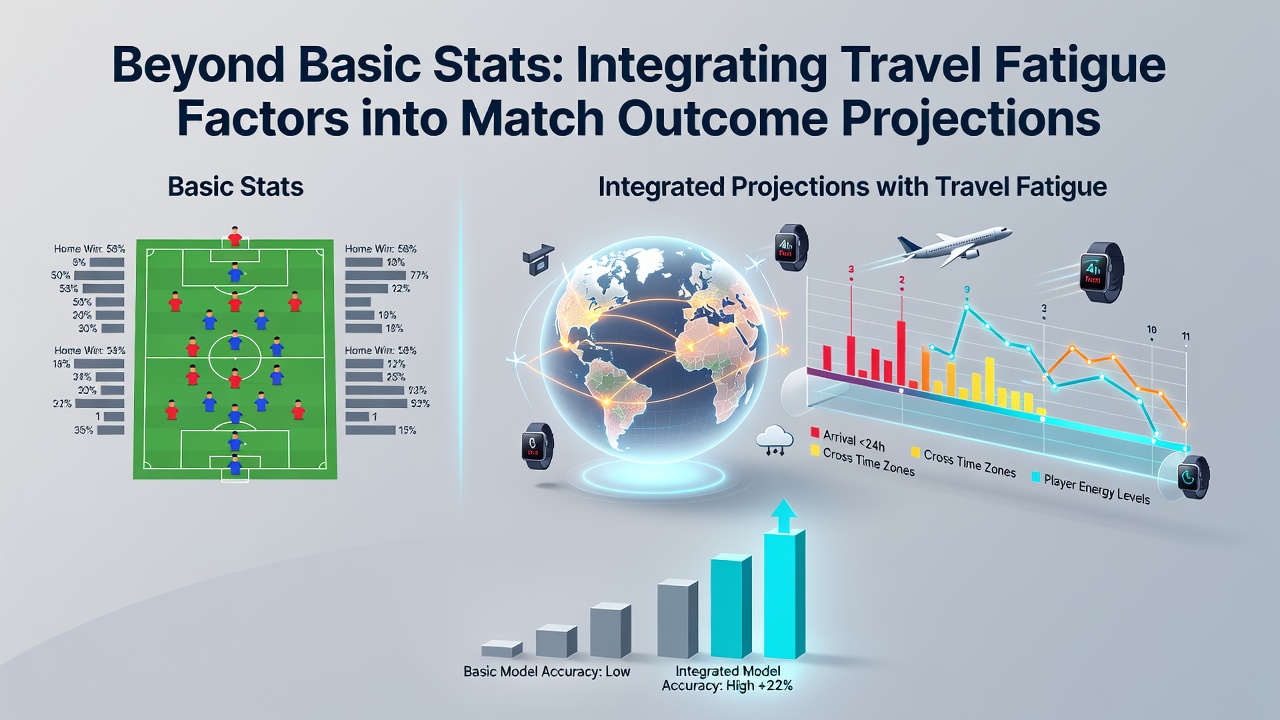
Traditional match outcome models rely on metrics such as possession percentages, expected goals, and historical head-to-head records, yet researchers increasingly incorporate travel fatigue as an additional variable that alters player recovery and performance consistency across domestic and international schedules. Travel fatigue emerges from extended journeys, multiple time zone crossings, and disrupted sleep patterns, all of which compound physical demands already present in elite competition calendars.
Defining Travel Fatigue in Football Contexts
Travel fatigue encompasses cumulative effects of long-haul flights, bus transfers, and irregular rest periods that reduce muscle recovery rates and cognitive sharpness during subsequent matches. Studies conducted by the Australian Institute of Sport have documented measurable declines in sprint speed and decision-making accuracy among athletes who cross more than three time zones within forty-eight hours before kickoff. These physiological changes occur because circadian rhythms require several days to realign, a timeline that compressed fixture lists rarely accommodate.
League data from major European and South American competitions shows that teams traveling over 1,000 kilometers for away fixtures record lower average distances covered in the final twenty minutes of play compared with home counterparts. The difference becomes statistically significant in back-to-back scheduling windows, particularly when matches occur midweek and require return travel the following day.
Incorporating Fatigue Metrics into Projection Models
Advanced projection systems now integrate travel distance, time zone differential, and days since last match as weighted inputs alongside conventional statistics. Analysts adjust baseline expected goal values downward for visiting sides that have logged more than 800 kilometers of travel within seventy-two hours, while simultaneously elevating the probability of draws or narrow defeats. Machine learning frameworks trained on five seasons of match data from multiple confederations demonstrate improved accuracy when fatigue variables receive explicit coefficients rather than remaining embedded in residual error terms.
One modeling approach applies a fatigue index calculated from flight duration multiplied by time zone shift magnitude, then scales the index against historical performance drops observed in comparable situations. This method allows forecasters to generate scenario outputs that distinguish between standard away disadvantages and amplified deficits caused by transcontinental schedules.
Evidence from Recent Seasons
During the 2025-2026 campaign, several clubs competing in both domestic leagues and continental tournaments exhibited performance variances that aligned closely with travel burden charts published by confederation medical committees. Midfield units in particular displayed reduced pass completion rates in the second half when cumulative travel exceeded thresholds identified in prior laboratory studies. Observers note that these patterns appear consistently across different climates and playing styles, suggesting the underlying mechanisms operate independently of tactical preferences.
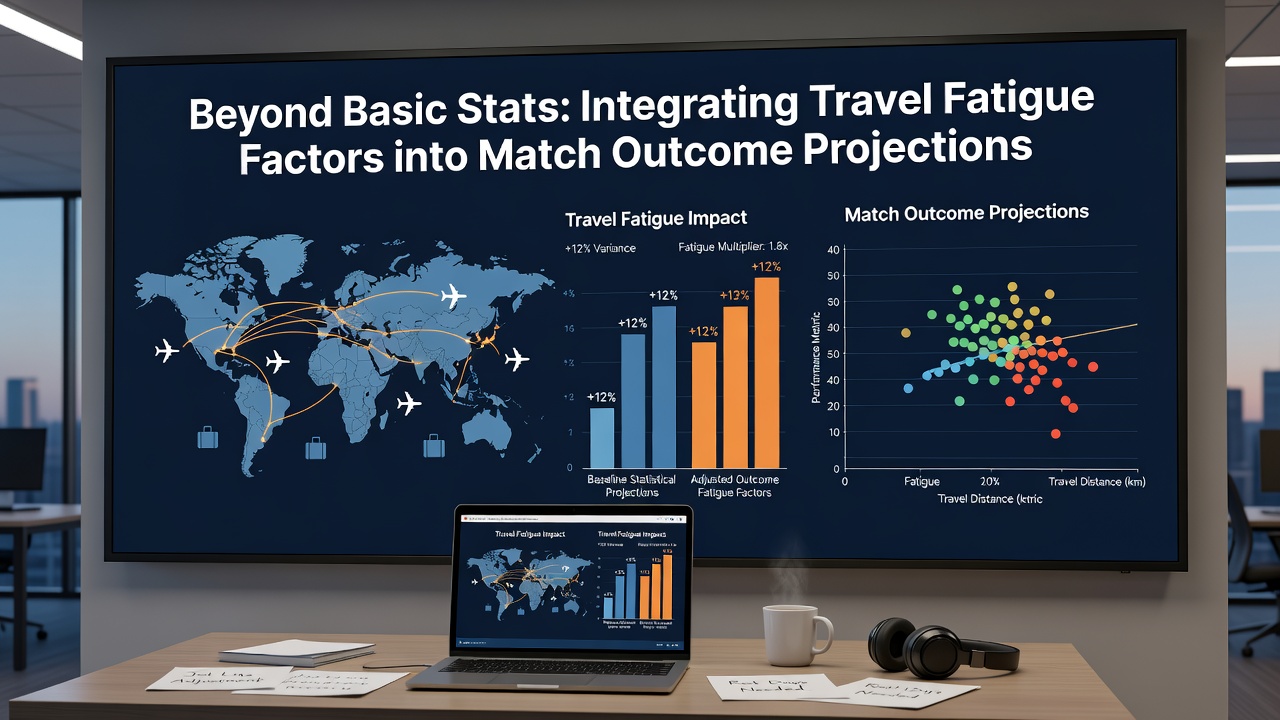
July 2026 schedules for international qualifiers and pre-season tours provide fresh datasets because many teams undertake long-haul journeys immediately after domestic seasons conclude. Early indicators from national federations indicate that recovery protocols emphasizing light training and controlled sleep environments can mitigate some measurable effects, although complete restoration still requires multiple days.
Regional Variations and Data Sources
North American professional leagues have published internal reports showing that cross-country flights correlate with increased injury incidence in the subsequent seven days, prompting adjustments to training loads upon arrival. In contrast, Asian competitions with extensive domestic geographies report similar patterns when teams navigate mountainous terrain or congested urban routes rather than solely relying on air travel metrics. These geographic differences highlight why universal fatigue models benefit from region-specific calibration using local fixture and transport records.
Academic institutions such as the University of Queensland have contributed peer-reviewed analyses that quantify recovery timelines across varying flight lengths. Their findings support the inclusion of a recovery multiplier in projection algorithms, particularly for tournaments where squad rotation options remain limited.
Implementation Challenges and Refinements
Building reliable fatigue layers into outcome projections requires granular data on actual travel itineraries rather than straight-line distance approximations. Some clubs release detailed movement logs while others withhold information, creating gaps that analysts address through indirect estimation techniques based on venue coordinates and kickoff times. Refinement continues as wearable technology provides objective markers of player readiness upon arrival at match venues.
Those who maintain projection systems report iterative testing cycles where fatigue coefficients undergo validation against holdout match samples from multiple seasons. The process reveals that certain player positions experience steeper performance curves under fatigue stress, prompting position-weighted adjustments within team-level forecasts. Such granularity improves differentiation between matches where travel impact remains marginal versus those where it becomes decisive.
Conclusion
Projection frameworks that integrate travel fatigue factors alongside established statistics produce outputs that better reflect real-world performance distributions across varied scheduling conditions. Continued collection of physiological and logistical data supports ongoing calibration of these models as fixture calendars evolve. The approach delivers measurable improvements in predictive alignment without displacing core performance indicators that have long guided outcome analysis.